Last October, when we pointed out that China's FX outflows had just hit a whopping $75BN - the single biggest monthly outflow since the 2015 currency devaluation - we concluded that the "unfavorable interest rate spread between China and the US will "likely imply persistent depreciation and outflow pressures in coming months", or in other words, September's biggest FX outflow in years is just the beginning, and very soon - in addition to geopolitics and central banks - the world will also be freaking out about the capital flight out of China... not to mention where all those billions in Chinese savings are going and which digital currency the Chinese are using to launder said outflows."
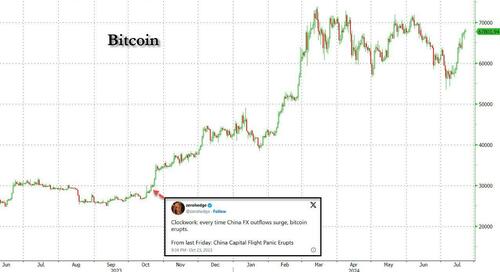
We wrote that on October 20, when Bitcoin was trading just under $30,000, a level it had been for much of 2023. And, just as we correctly predicted at the time...
Clockwork: every time China FX outflows surge, bitcoin erupts.
— zerohedge (@zerohedge) October 24, 2023
From last Friday: China Capital Flight Panic Eruptshttps://t.co/j0eWLnbFMq
... following this surge in Chinese FX outflows, bitcoin - traditionally China's preferred means to circumvent Beijing's great capital firewall since gold is, how should one put it, a bit more obvious when crossing borders - promptly soared more than 100% higher in the next 4 months.
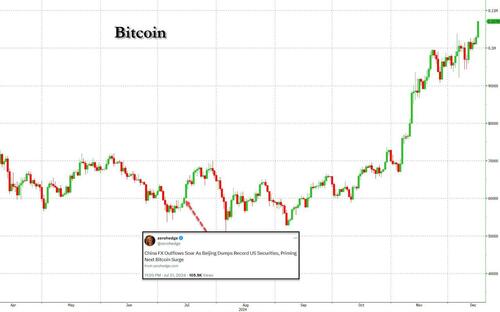
That was just the start, because only a few months later, in July, we wrote the follow up as China's capital flight returned with a vengeance, namely "China FX Outflows Soar As Beijing Dumps Record US Securities, Priming Next Bitcoin Surge" which coincided with a Reuters report according to which, it was China's massive wall of inert capital that has been one of the key drivers of bitcoin moves, and never more so than during periods of FX and capital outflows which usually precede some form of capital controls... which regular (and hopefully very rich) readers will of course, recall has been our core, and unwavering, bitcoin thesis since 2015!
In any event, the sharp resumption of Chinese capital outflows, which we highlighted in July, is why we also predicted at the time that "almost a year after our first correct prediction that China's spike in FX outflows would send bitcoin surging, it's time to do it again."
You'll never guess what happened next... And in case you really can't, here is the answer: bitcoin exploded, nearly doubling again over the next 5 months!
We bring all this up because more than a year after our first correct prediction that China's spike in FX outflows would send bitcoin surging, and almost six months after our second correct prediction that China's spike in FX outflows would send bitcoin surging (sic), it's time to do it again.
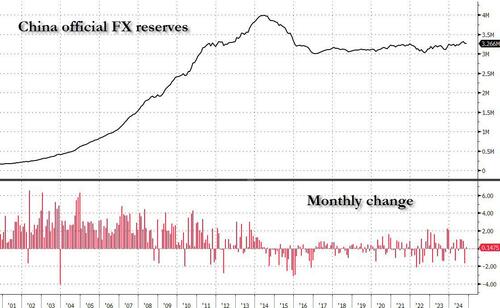
One wouldn't know it, however, if one merely looked at the official Chinese FX reserve data published by the PBOC, here nothing sticks out. In fact, at $3.3 trillion, reported Chinese reserves are now near the highest level in past nine years, and monthly flows are very much stable as shown in the chart below.
The problem, of course, is that as we have explained previously China's officially reported reserves are woefully - and purposefully - inaccurate of the bigger picture.
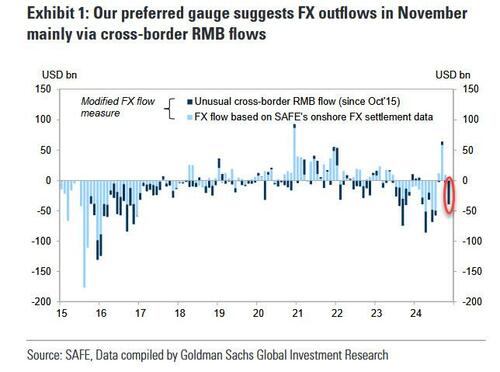
Instead if one uses our preferred gauge of FX flows, one which looks at i) onshore outright spot transactions; ii) freshly entered and canceled forward transactions, and iii) the SAFE dataset on “cross-border RMB flows, we find that China's net outflows were a remarkable $39 billion in November, and while (still) a far cry from the massive outflows which we reported earlier this year, is a dramatic and major reversal to the impressive inflows noted in the previous three months.
What is especially notable is that if one just uses the current account channel, one would conclude that November had FX inflows, similar to the official PBOC data. However, one has to also look at the portfolio investment channel to observe the cross-border RMB outflows, likely due to RMB outflows, which led to the sizeable FX outflows in November.
Here are the details: in November, there were US$2bn in net outflows via onshore outright spot transactions, and US$2bn inflows via freshly entered and canceled forward transactions. However, our favorite SAFE dataset on “cross-border RMB flows” showed outflows of US39bn in the month, suggesting net receipts of RMB from onshore to offshore. Our preferred FX flow measure therefore suggests US$39bn net FX inflows in November, in comparison with US$5bn net FX inflows in October (shown on chart above).
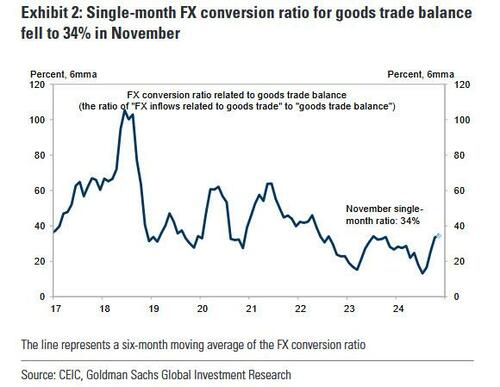
The current account channel showed slowed net inflows (US$17bn in November vs. US$28bn inflows in October). There was a net inflow of US$33bn related to goods trade in November vs. an inflow of US$45bn in October. Goods trade surplus FX conversion ratio fell further to 34% in November (vs. 47% in October), well below the average ratio (45%) in 2019-21.
The FX outflows related to services trade deficit was mostly unchanged at US$14bn from October to November. The income and transfers account showed outflows of US$2bn in November, slightly slower than the US$3bn outflows in October.
Turning to the far more important portfolio investment channel (which is where crypto flows tend to be located) we find net FX outflows in November (US$6bn in November vs. US$3bn outflows in October). Bond Connect flows showed US$14bn outflows vs. US$20bn outflows in October. Although FX outflows via portfolio investment channel remained small in November, the large cross-border RMB outflows implies potential outflows from the onshore equity market.
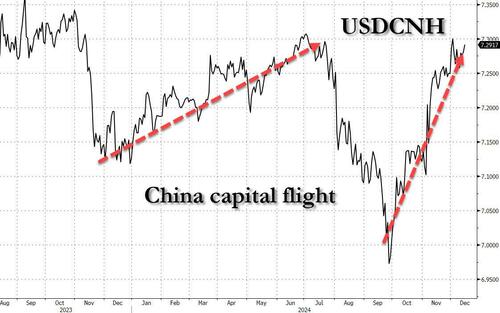
Remarkably, all this takes place when the official FX reserves (released earlier in the month) number rose slightly to US$3,266bn in November from US$3,261bn in October. Luckily, there is a simple "sanity check" way to confirm that the capital inflows story is pure propaganda BS, and China is once again suffering another scorching period of capital flight: just look at FX. Indeed, after after the yuan surged in the fall, coinciding with a period of relative dollar weakness, since October we have seen a surge in the USDCNH spot, as one would expect when there is capital flight.
But wait there's more.
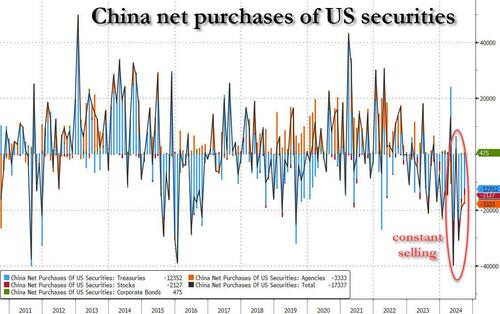
Where the capital flight story gets really interesting, is when we look at what Chinese public and private entities were doing with US assets according to official Treasury data. What we find is that according to Treasury International Capital data, in September Chinese investors sold $17BN in US securities (bonds, MBS, corporate bonds, and stocks), and more notably, following a record sale in May, China has been a constant seller of US securities in the past 5 months!
So if one had to guess what was going on, even as the yuan slumped in October and November as the capital flight resumed, the hit to the yuan would have been even bigger had China not liquidated a record amount of US securities, while the PBOC was buying much more gold while China's middle and upper classes were buying up bitcoin.
And while Chinese policymakers are still keen on maintaining FX stability (or at least create that impression) as the countercyclical factors in the daily CNY fixing remained deeply negative and front-end CNH liquidity tightened notably in recent weeks, the reality is that with China desperate to boost its exports at a time when its great mercantilist competitor, Japan, has hammered the yen to the lowest level in 3 decades, it is only a matter of time before the currency devaluation advocates win, as they did in 2015. No surprise that the biggest China-related story last week came from Reuters, and reported that Beijing in already planning how to devalue the yuan in response to Trump tariffs. And if you want to see what capital flight from China really looks like, just wait until we get another 2015-style one-time devaluation.
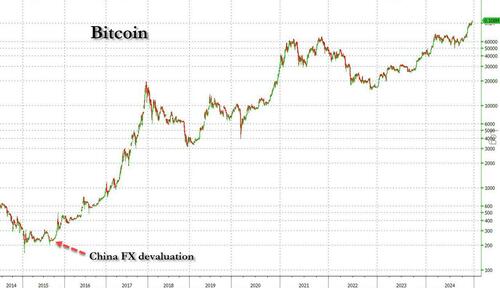
We hope we don't have to remind readers that the first big trigger for bitcoin's unprecedented eruption higher starting in 2015 was - you guessed it - China's August 2015 FX devaluation, as we correctly noted at the time when we predicted that bitcoin would explode from $250 to the thousands; in retrospect we were very conservative.
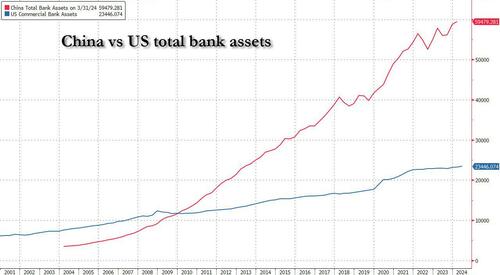
So don't be surprised if in the next 6 months Bitcoin doubles again - for the third time in the past year - and the move has little to do with ETF inflows, the halving, or frankly anything else taking place in the US, and instead is entirely driven by China's massive wall of money which at last check was almost 3x bigger than the US.

