By Todd Maiden of FreightWaves
August data from Cass Information Systems showed the freight market continues to trudge along what is expected to be a trough. Both shipments and freight spend stepped lower from year-ago levels.
Shipments captured by the Cass Freight Index fell 1.9% year over year in August, following a 1.1% y/y decline in July. The August result came in ahead of a projected decline of 3%.
“These were the smallest declines in 18 months as goods demand continues to grow slowly, and slowing capacity additions reduce the pressure on for-hire shipments,” the Monday report stated.
The volume dataset improved 1% seasonally adjusted from July, a second consecutive monthly increase (up 3.1% seasonally adjusted in July) but remained 12.3% lower than the 2022 level.
The shipments index is expected to be down 3% y/y in September and off 3% to 4% for all of 2024 after a 5.5% decline last year.
The update from Cass appears to be in line with comments from trucking heads at an investor conference held last week. Some of the nation’s largest truckload carriers like Schneider National and Werner Enterprises said the industry is still coming out of a protracted recession and that there has been no market inflection, just normal seasonal demand trends.
The expenditures index, which logs total freight spend, fell 9% y/y and 1.3% (seasonally adjusted) from July. The index was off 6.2% y/y last month, which was the smallest decline since the beginning of 2023. Compared to two years ago, total freight spend was off nearly 32% in the month.
The expenditures index was down 16% y/y in the first half of the year and is expected to be off 11% to 12% for the full year as the declines have eased.
Excluding the impact that lower shipments had on the expenditures data, “inferred freight rates” were down 7% y/y and 2% sequentially in August to “a new cycle low.” However, a 3% decline in diesel fuel prices from July to August (down 16% y/y) weighed on inferred rates during the month.
Inferred rates are expected to decline 8% y/y this year after a 14% decline last year.
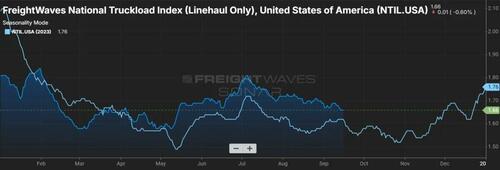
The Cass Truckload Linehaul Index, which records core linehaul rates excluding changes in fuel and accessorial surcharges, declined 3.3% y/y in August and 0.6% sequentially. This was the fourth consecutive sequential decline as “overcapacity keeps bids highly competitive.”
The TL linehaul index includes both spot and contract freight.
“With spot rates steady over the past year, downward pressure on the larger contract market is lessening, but recent slight increases in spot rates are not yet enough to turn contract rates higher,” the report said.
Data used in the indexes is derived from freight bills paid by Cass, a provider of payment management solutions. Cass processes $38 billion in freight payables annually on behalf of customers.


