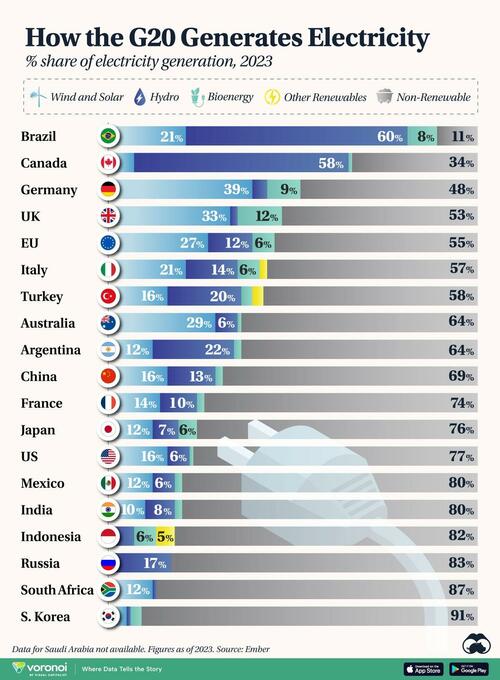
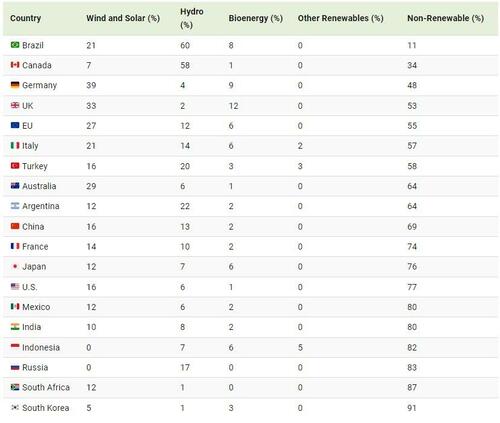
This graphic, via Visual Capitalist's Bruno Venditti, shows how much electricity is generated from renewable sources among G20 countries.
The data is based on Ember’s yearly and monthly electricity reports as of 2023. Data for Saudi Arabia is not available.
Brazil Leading in Renewable Energy
The global average for renewable electricity is 30%, but nearly half of the G20 countries fall below this average.
Brazil leads the G20 in renewable electricity, with 89% of its power generated from renewables in 2023. The country’s high share of renewables is due to its robust hydroelectric base and rapid expansion of solar and wind energy.
Canada, in second place, generates 66% of its electricity from renewables, primarily hydropower.
Germany, in third place, has the highest proportion of wind and solar in its energy mix.
G20 Economies Past the Peak of Fossil Power
The majority of G20 economies are at least five years past their peak power sector emissions.
At the top of our list, Brazil’s power sector emissions peaked in 2014 at 114 million tonnes of CO2 (MtCO2). By 2023, nine years after the peak, its power sector emissions were 38% below 2014 levels, at 70 MtCO2.
To learn more about this topic, check out this graphic showing emission reduction targets by country in 2024.


